Observability
Debug runtime behavior from Orbit first.
Use fleet metrics, project metrics, logs, proxied requests, and terminal access before changing application code.
Fleet metrics
Compare project health at a glance.
Metrics sample every five seconds while projects run. Orbit stores request volume, errors, latency percentiles, memory, CPU, uptime, connections, attempts, wake time, crashes, and auto-stops.
- Open Metrics for a fleet-level view.
- Change the interval to inspect the last hour, day, week, two weeks, or thirty days.
- Filter visible projects when the graph needs less noise.
- Open project metrics when one runtime needs detail.
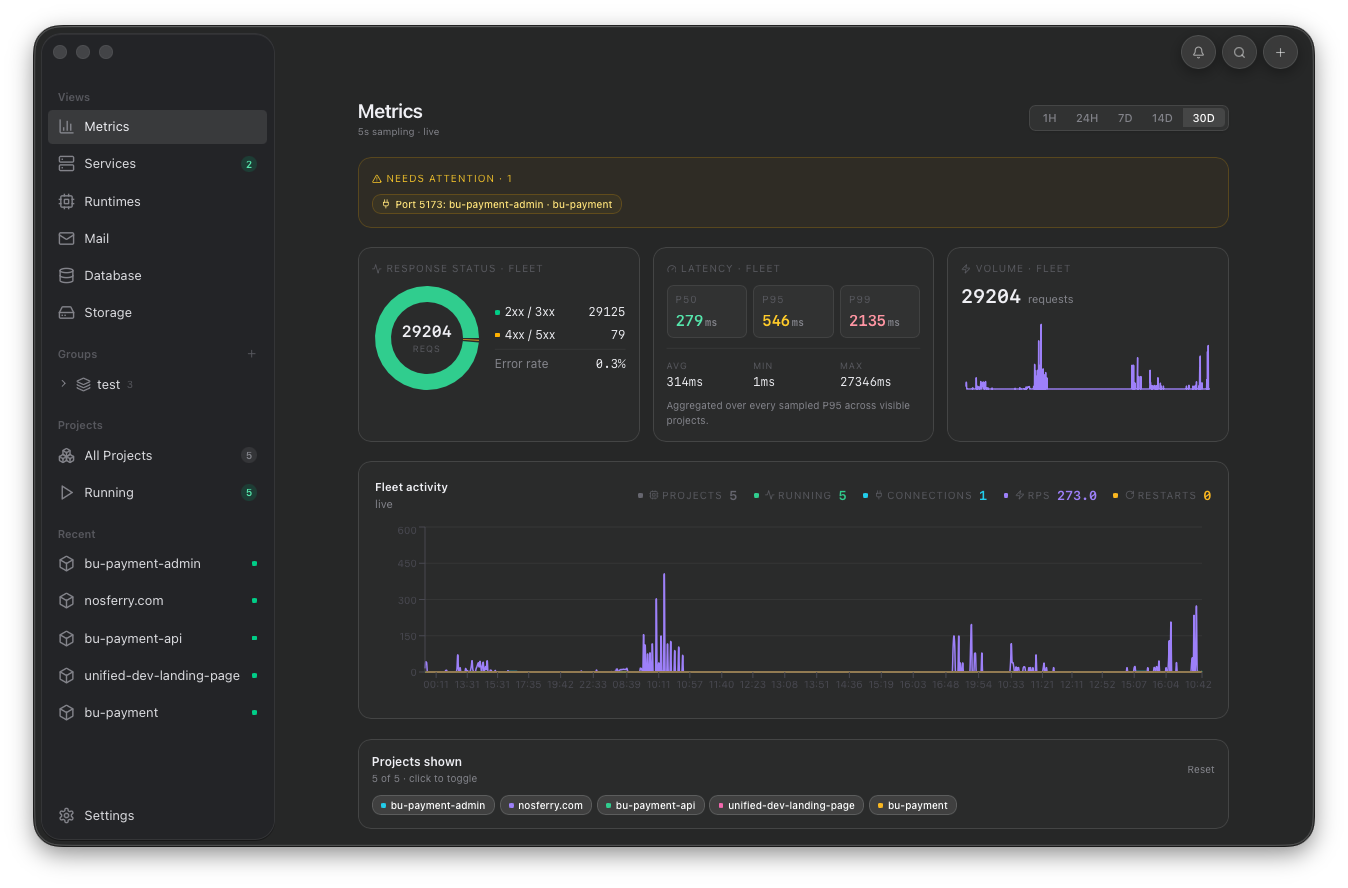
Use fleet metrics to decide where to drill in. Attention rows, request volume, latency, and wake behavior point to the project that needs inspection.
Project metrics
Focus runtime signals on one selected app.
Project metrics keeps runtime health, process resources, uptime, and recent samples scoped to one project after the fleet view identifies where to look.
- Open project metrics from the dashboard or project detail action.
- Compare request volume, latency, memory, CPU, and uptime together.
- Return to Logs or Requests when the metric points at a runtime or traffic issue.
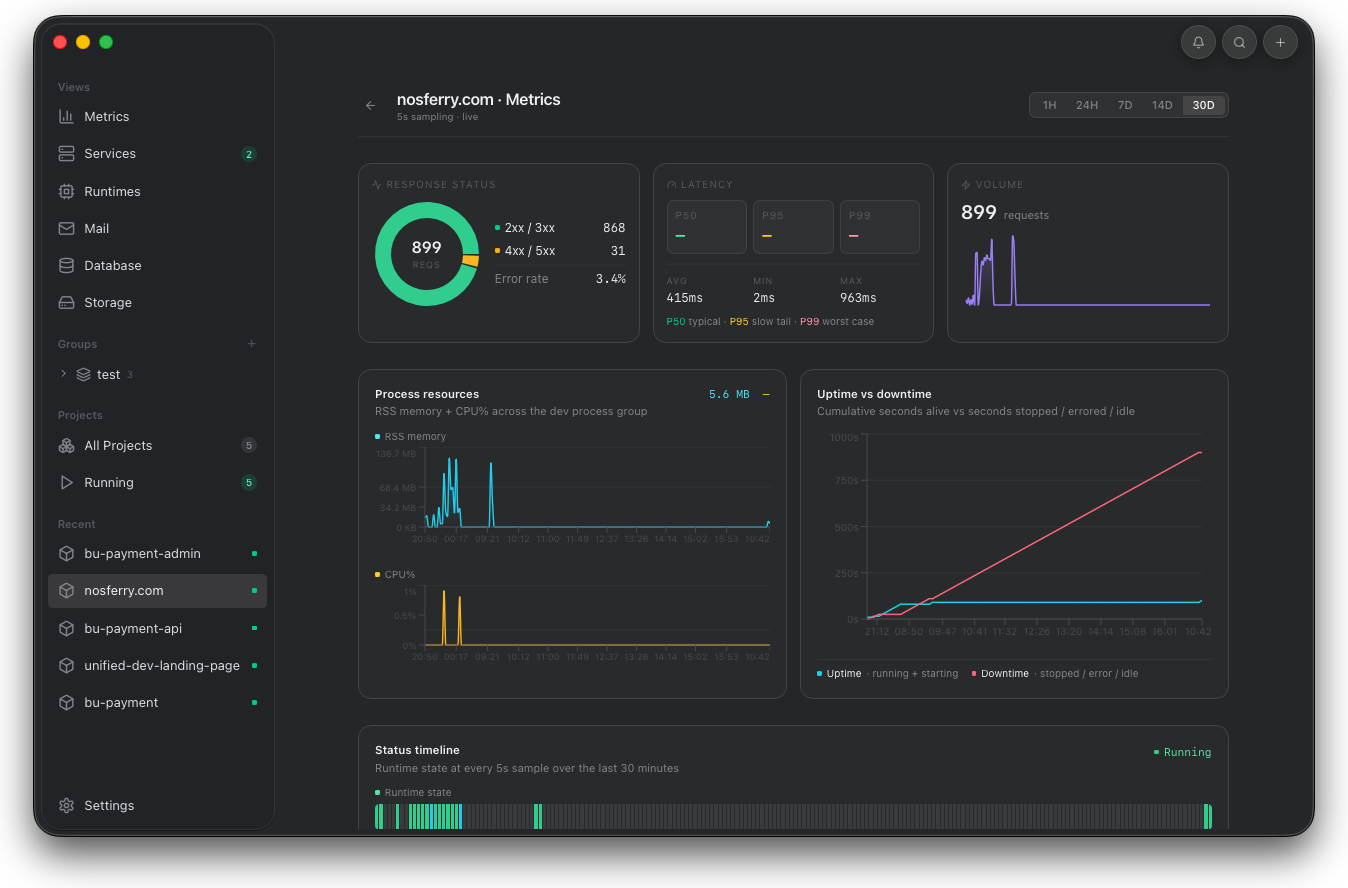
Use project metrics after selecting one app. The view keeps runtime health, process resources, uptime, and recent samples scoped to that app.
Runtime logs
Read runtime output where the project runs.
Orbit captures recent stdout and stderr lines for the active runtime and stores runtime events so failed starts, installs, crashes, and service problems can be inspected later.
- Open the Logs tab inside project detail for live output.
- Open the project logs page from the dashboard or detail action when the screen should focus on history.
- Clear the live buffer only when the next run needs a clean view.
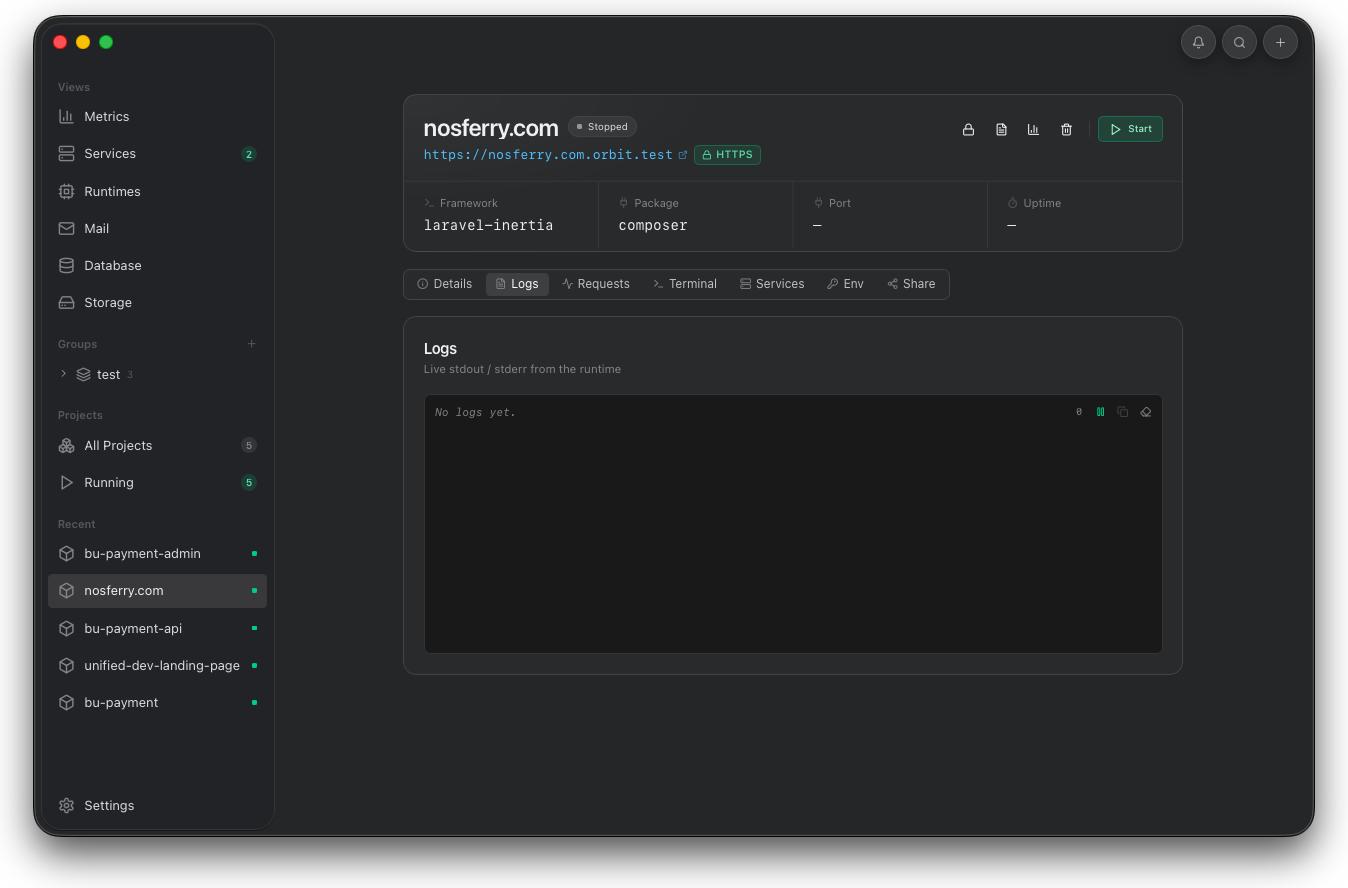
Use the attached tab while you stay on the project detail screen. It is best for quick checks after start, restart, or clear output.
Log history
Give runtime events more room when diagnosis takes longer.
The project logs page focuses on runtime history when live output, install events, crashes, or service messages need more space than the detail tab provides.
- Open the project logs page from the dashboard or project detail action.
- Use the wider view when history needs to stay visible during a fix.
- Search or filter before restarting the runtime.
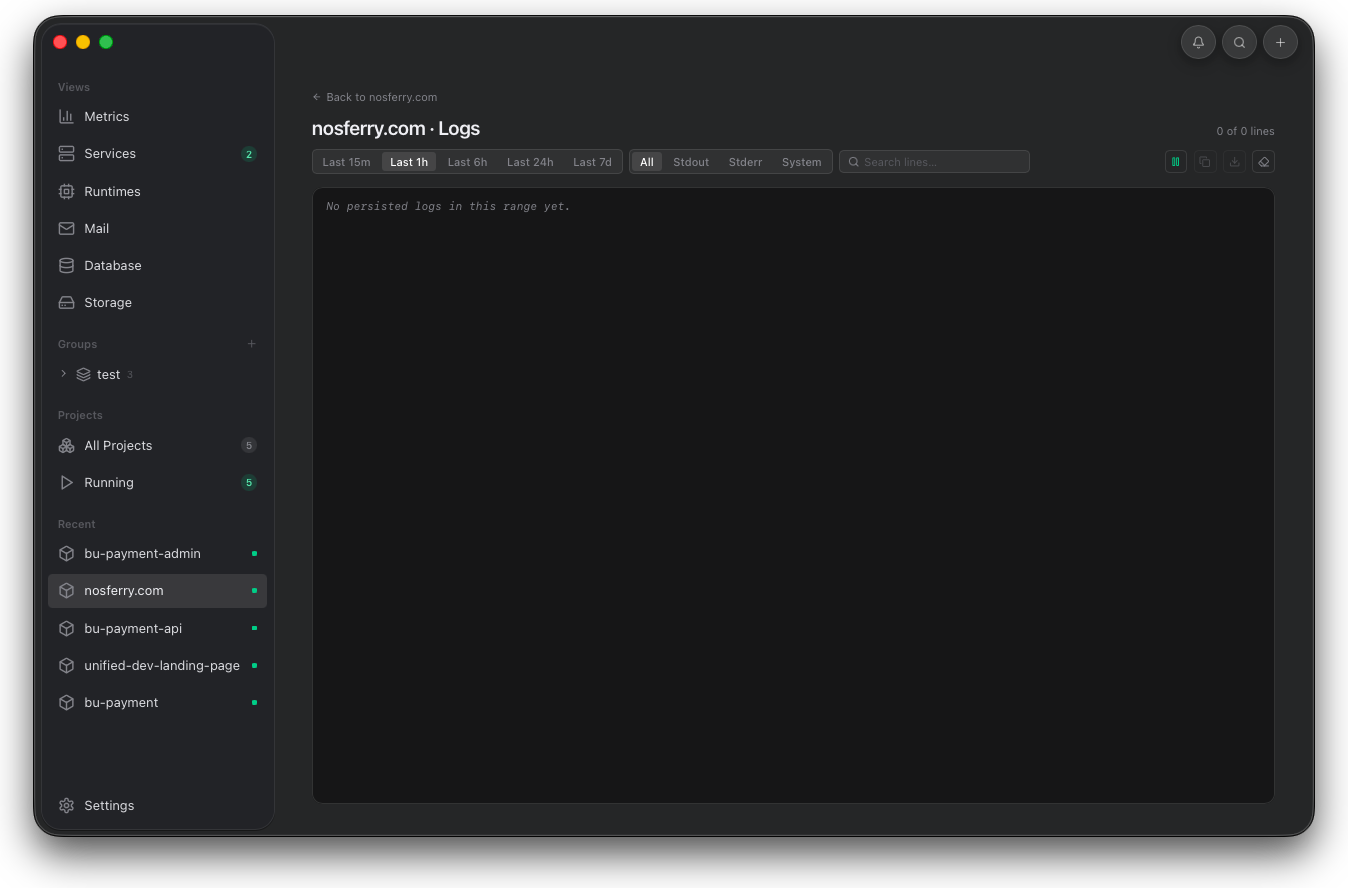
Open the full logs page when history needs more room. It keeps runtime events and output readable during longer diagnosis.
Request history
Verify traffic through the proxy.
Orbit keeps the last 200 proxied requests per project, newest first. The request view shows method, status, path, duration, response size, timestamp, and WebSocket traffic.
- No rows usually means the browser did not hit the Orbit domain.
- A 500-series status points at the app runtime, not the proxy alone.
- High duration with low CPU suggests the app is waiting on a dependency.
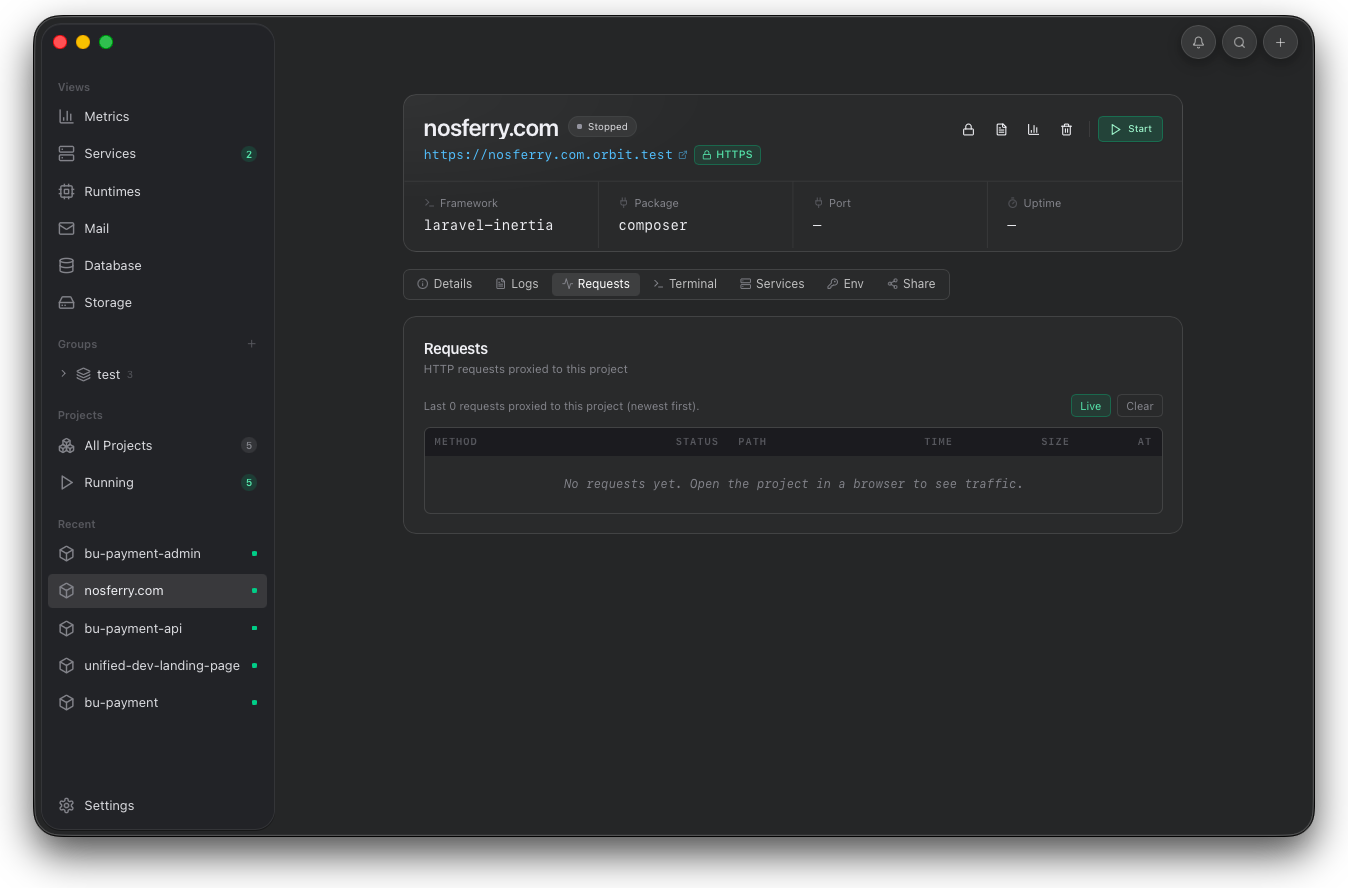
Use this view when the browser loads the domain but the app result is unclear. Status, path, time, and size show what the proxy delivered.